Setting the Scene
Introduction to Variables and Types of Evidence
An Important Update for 09:10 AM Class
Class Location Update!
Our classes will be held in Building 010-0222 starting on Tuesday, September 23.
Today’s Outline
Late Submission Policy
Extra Credit
Lab 0 Instructions
Data, Observational unit, Variable
Types of Evidence
Late Submission Policy
I do not want class deadlines to cause you extreme stress or anxiety.
I offer 3 “grace days” – days to turn in the assignment late without a penalty.”
These can be used ONLY on weekly assignments, lab assignments and investigation assignments (a single group member must be willing to use one of their grace days for the entire group), but NOT exams or the midterm group project.
These “grace days” can be used all at once on a single assignment or used on separate assignments throughout the quarter. Simply add a comment on the assignment in Canvas BEFORE THE DEADLINE.
After the expiration of your ‘grace days,’ a 10% grade reduction will be applied for each day that the assignment is overdue.
Late submissions will not be accepted after one week from the original due date.
Resubmitting assignments is not allowed.
Extra Credits - Week 1
- 3 short extra credit opportunities - See Canvas
- Participant Informed Consent
- Curiosity Pre-test
- I wonder #1
Installing R for STAT 218
Install R and RStudio
Install R: Yes, you do need to download and install R even if you have downloaded before. There is a newer version and it is free.
Install RStudio: Yes, you do need to download and install RStudio even if you have downloaded before. There is a newer version. Download the free Desktop version.
After installation, try the following test and contact if you need help.
Is my RStudio working?
If it is not working…
This Week’s Glossary
Glossary
The main terms that we will learn today:
- Data
- Data Frame
- Observational Unit (case, study subject)
- Variable
- Categorical
- Binary (if it has 2 sub-groups)
- Binary (if it has 2 sub-groups)
- Quantitative
- Categorical
- Anectodal Evidence vs. Empirical Evidence
- Observational Study & Experimental Study
- …
Data
Recorded values, whether numbers or labels, together with their context are called data.
Data Sources
Data can be obtained:
Through research
- Experiments (with variable manipulation)
- Observational studies (without manipulation)
- …
From information collected by public or private agencies
From online sources (e.g., websites, databases)
Data Frame
All data have a context.
Data are often organized into a data table or data matrix. See the next slide.
Data Frame/Matrix
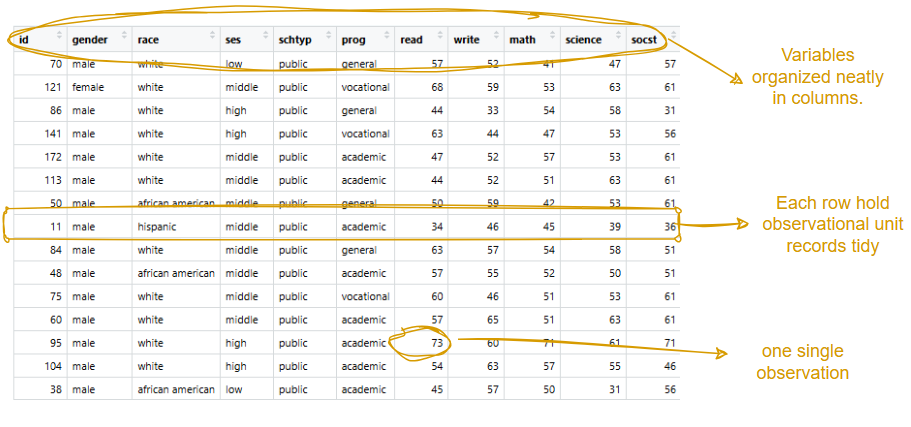
Observational Unit
- The person or thing being measured.
- Case, study subject, experimental unit are other names for it.
Variable
- Any characteristic of a person or thing that can be assigned a number or category.
Categorical Variable
When a variable names categories and answers questions about how cases fall into those categories, it is called a categorical variable.
- e.g., eye color (green, blue, brown)
may only have two possible values (like “yes” or “no”).
- We call them binary variables.
may be a number like a zip code.
Quantitative Variable
When a variable has measured numerical values with units and the variable tells us about the quantity of what is measured, it is called a quantitative variable.
e.g., temperature (F or C), speed (mph)…
Data Frame/Matrix Revisited
But…
Data alone can’t make good decisions. We need a solid approach.
Types of Evidence
Anectodal Evidence
- An anecdote is a concise story or illustration of a captivating event.
- E.g., A man on the news got mercury poisoning from eating swordfish, so the average mercury concentration in swordfish must be dangerously high.
Important
Be cautious when handling data collected in a haphazard manner.
While such evidence may be authentic and verifiable, it often represents exceptional cases rather than forming a reliable basis for general conclusions.
Empirical Evidence
We need empirical evidence to make decisions in science.
Statistical studies help us design research collect, organize, summarize, visualize and analyze data.
Observational Studies
- In an observational study, the researcher systematically collects data from subjects as an observer, without manipulating conditions.
Important
The Presence Confounding Variables: Observational studies may lead to misinterpretations due to the presence of confounding variables.
The context in which data collected is crucial in statistics. It alerts us to potential effects of other factors.
Data analysis without reference to context is considered meaningless.
Experimental Studies
Sinusitis and Antibiotics. Researchers studying the effect of antibiotic treatment for acute sinusitis compared to symptomatic treatments randomly assigned 166 adults diagnosed with acute sinusitis to one of two groups: treatment or control. Study participants received either a 10-day course of amoxicillin (an antibiotic) or a placebo similar in appearance and taste. The placebo consisted of symptomatic treatments such as acetaminophen, nasal decongestants, etc. At the end of the 10-day period, patients were asked if they experienced improvement in symptoms.
Experimental Studies
The design of this experiment allows for the investigation of the interaction between two factors:
self-reported improvement in symptoms and group type (experimental/placebo).
In this scenario, researchers applied the conditions—specifically, different group types to the subjects, which were Homo sapiens.
By randomly assigning treatments to the subjects, we can address the issue of confounding that complicates observational studies, thereby expanding the scope of conclusions we can draw from the research.
Randomized Experiments as the Pinnacle in Scientific Inquiry: Randomized experiments are often regarded as the pinnacle in scientific investigation due to their ability to overcome confounding.
- However, it’s crucial to acknowledge that they are not without their own set of challenges.
Experimental Studies
Randomized experiments are generally built on four principles.
- Controlling
- Randomization
- Replication
- Blocking
Reducing Bias in Experimental Studies
We can reduce bias in experimental studies by employing:
- Treatment/Control Group
- Placebo Group
- Blinding / Double Blinding
- Placebo Group
Placebo
Placebos are commonly administered to human subjects in experiments, often in the form of an inert substance like a sugar pill.
The well-documented placebo response illustrates that individuals frequently exhibit positive reactions to any treatment, even when it lacks active ingredients.
In many cases, a placebo leads to a subtle yet genuine improvement in patients, a phenomenon known as the placebo effect.
- However, when implementing a placebo control, it is crucial for subjects to remain unaware of their group assignment—whether they are receiving the active treatment or the inert placebo.
Blinding/Double-Blinding
If researchers keep patients unaware of their treatment, the study is termed blind.
When both researchers and patients remain unaware of the individuals in the treatment groups, it is referred to as double-blind.